

【AZ-900】What Is Azure Monitor? Explanation of the Big Picture of the Monitoring Tool
Hi, I’m Makoto, a freelance engineer.
In this article, I’ll explain Azure Monitor.
It’s an essential service for running and managing systems built on Azure.
Although it’s a service that handles infrastructure monitoring, its functions are diverse, so it’s important to understand the big picture first.
I’ll explain with screenshots from the Azure portal, so please read to the end.
Let’s get started!
What is Azure Monitor?
Azure Monitor is a collective term for services that collect usage statistics from cloud and on-premises servers for analysis and monitoring. It’s the equivalent of “Cloud Watch” in AWS.
For AZ-900 exam preparation, when you think of monitoring, remember Azure Monitor.
Azure Monitor is treated as a service that integrates (bundles) multiple services. It has a history of integrating previously separate services under the Azure Monitor service name.
It may be easier to understand if you think of Azure Monitor as an entry point (portal site) for monitoring and analysis.
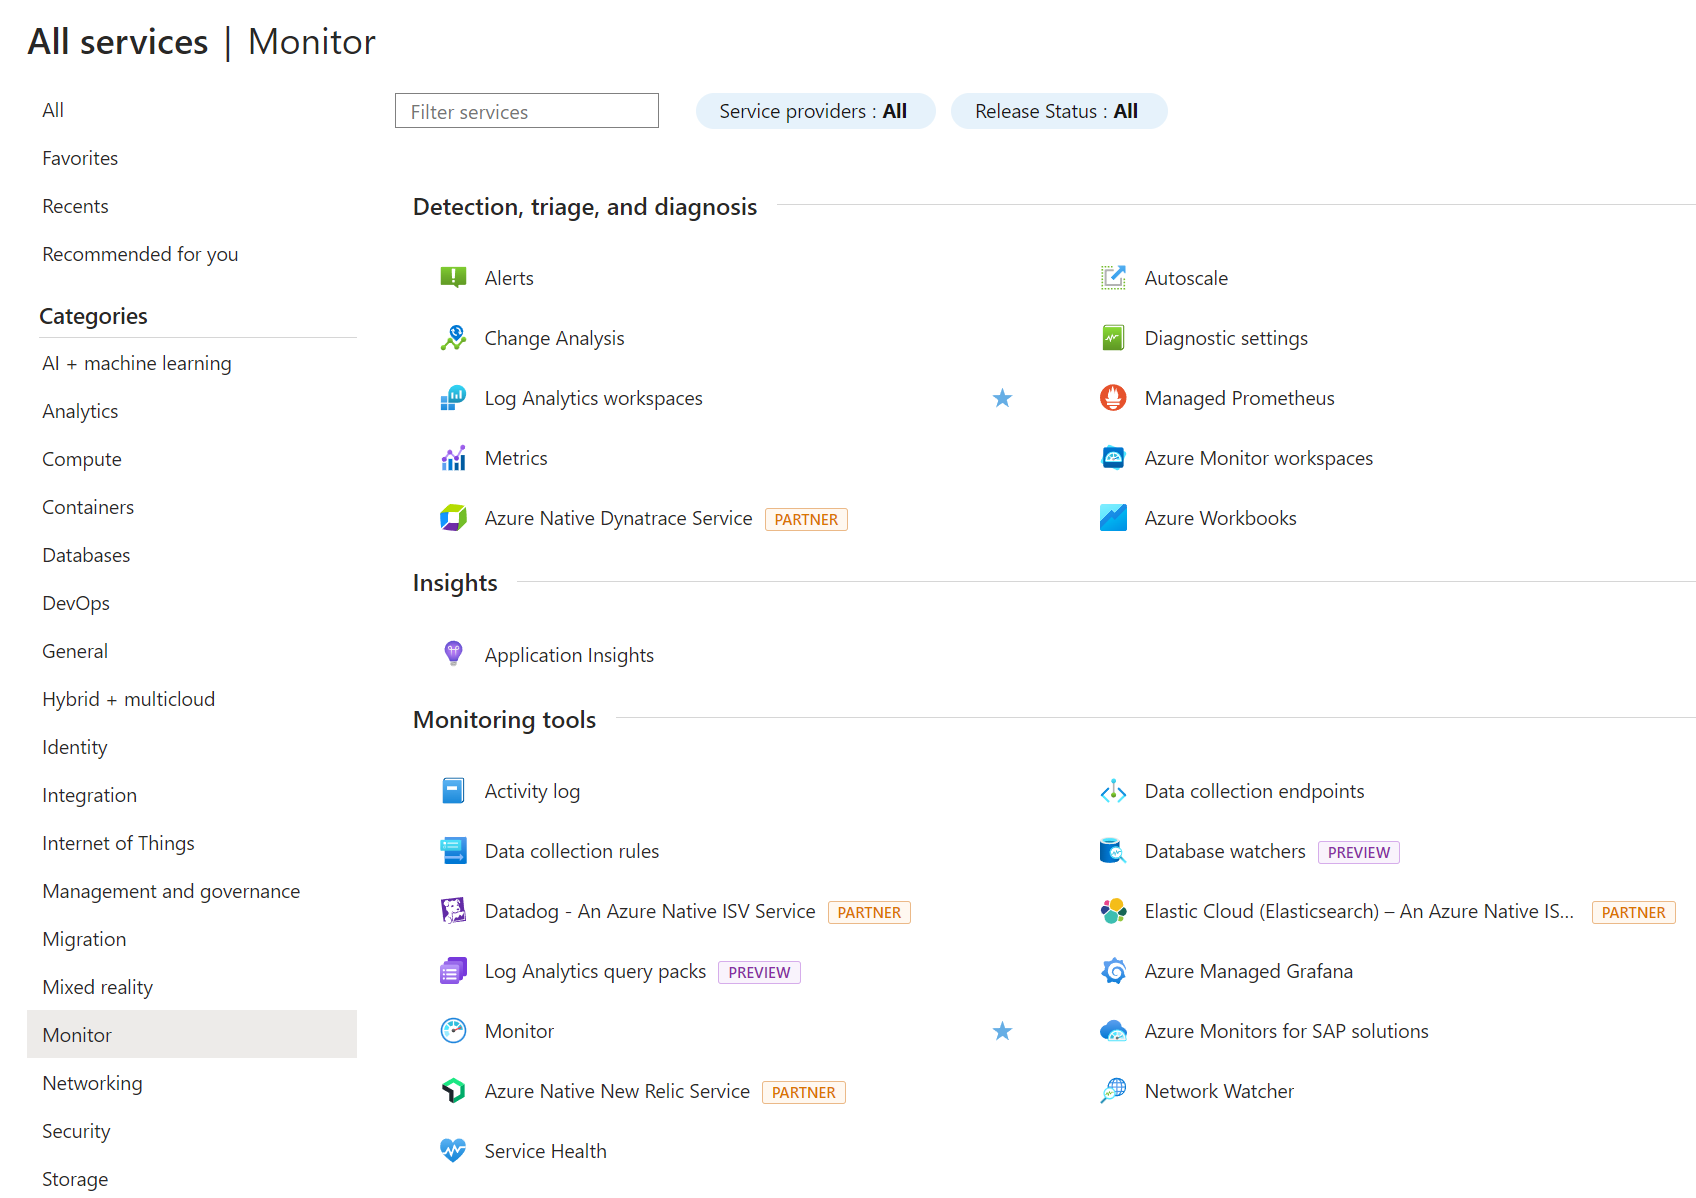
In the Azure Portal, you can access it from the Monitor menu.
If you actually look at the Monitor menu, you will see that there are several menus available for reviewing metrics, logs, and insights for applications and networks.
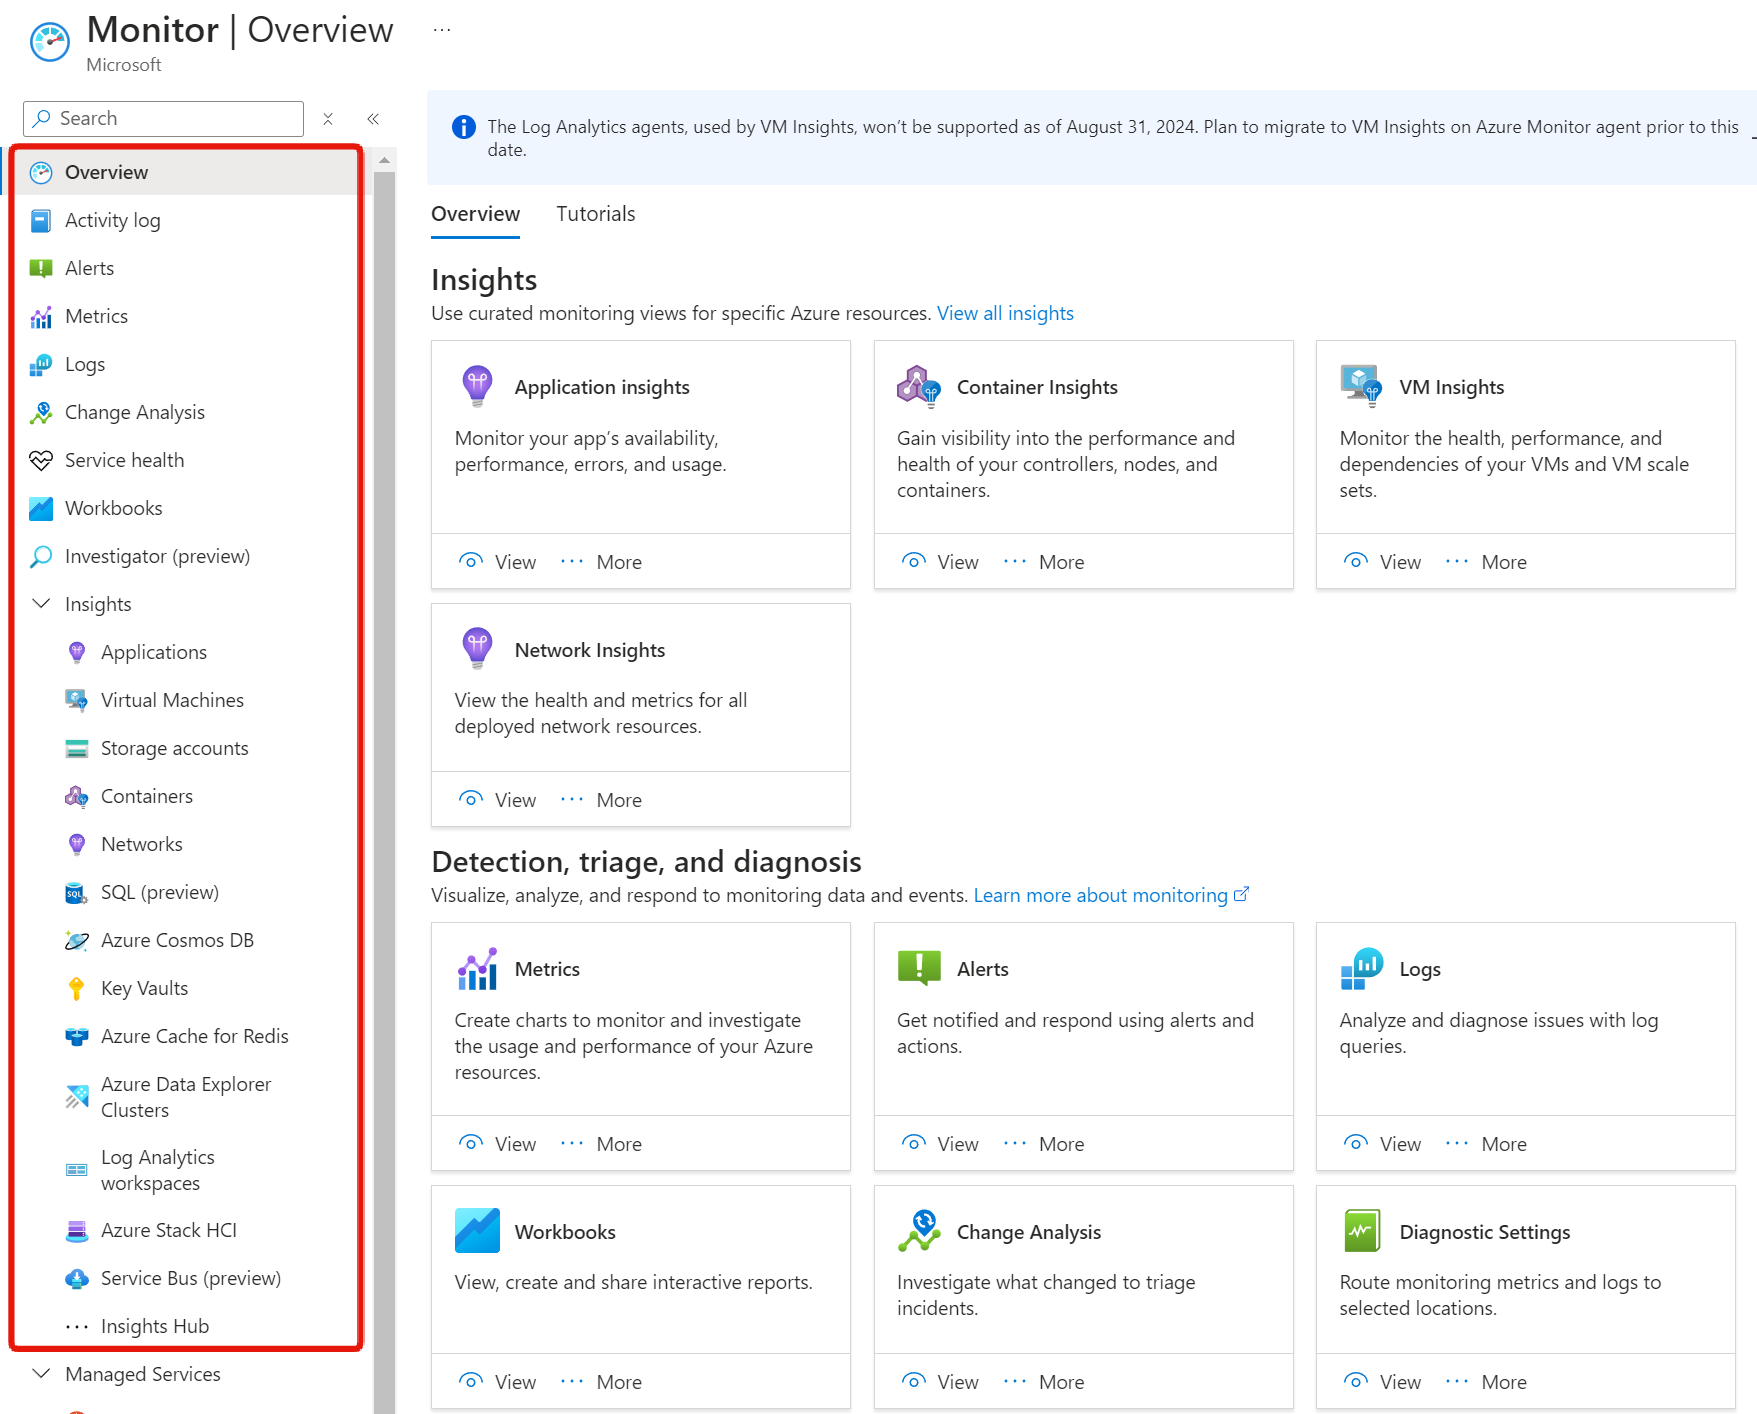
Some of the menus (functions) shown here can also be accessed directly from “All services” or by selecting a category.
Overview of Azure Monitor
The big picture of Azure Monitor can be simply represented as follows:
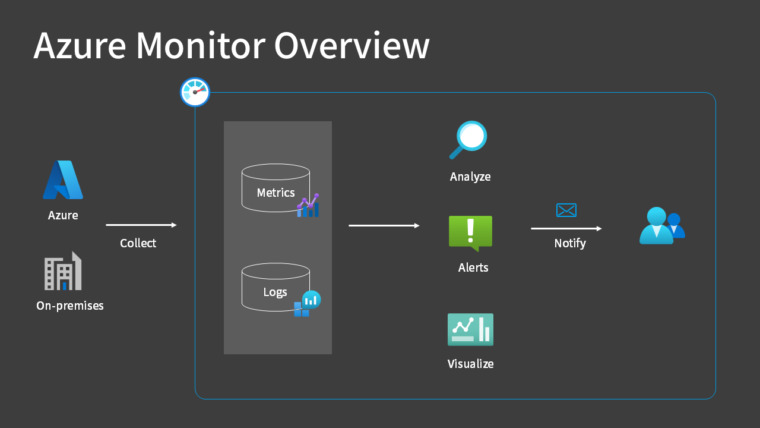
As data sources, in addition to resources on Azure such as virtual machines, you can also collect data from on-premises servers by installing agents.
Reference:
Although not shown in this diagram, you can also install agents on servers in other cloud providers, such as AWS, to collect data.
The data formats collected can be broadly divided into two types:
| Data Type | Description |
|---|---|
| Metrics | A numerical value obtained by measuring some aspect of a system |
| Logs | Events that have occurred in the system |
Metrics are performance-related data, such as CPU and memory or network traffic measurements, that can be displayed as graphs. In general, anything that can be expressed numerically is a metric.
Logs, as the name implies, record all events that occur within the system, and in many cases, the data is stored in a resource called a Log Analytics workspace.
You can monitor the accumulated metrics and logs, and send notifications via email, phone, or smartphone app (Azure mobile app) when specified conditions are met (Alerts).
You can also analyze with queries, visualize with dashboards, or integrate with external systems. It can be a bit complicated due to its many capabilities, but for exam preparation, focus on the following points:
Key Points:
- Azure Monitor is an integrated service for monitoring servers and applications
- Alerts can be used to send notifications in the event of an abnormality
- It can monitor on-premises servers as well as Azure
Key Features of Azure Monitor
Although we’ve already touched on some of them, here are the key features of Azure Monitor:
| Feature | Description |
|---|---|
| Activity Log | Log of operations performed on resources |
| Alerts | Notification of anomalies |
| Metrics | Collect resource performance data |
| Logs (Azure Monitor logs) | Collect and analyze logs |
| Application Insights | Collect application performance and usage data |
Activity Log
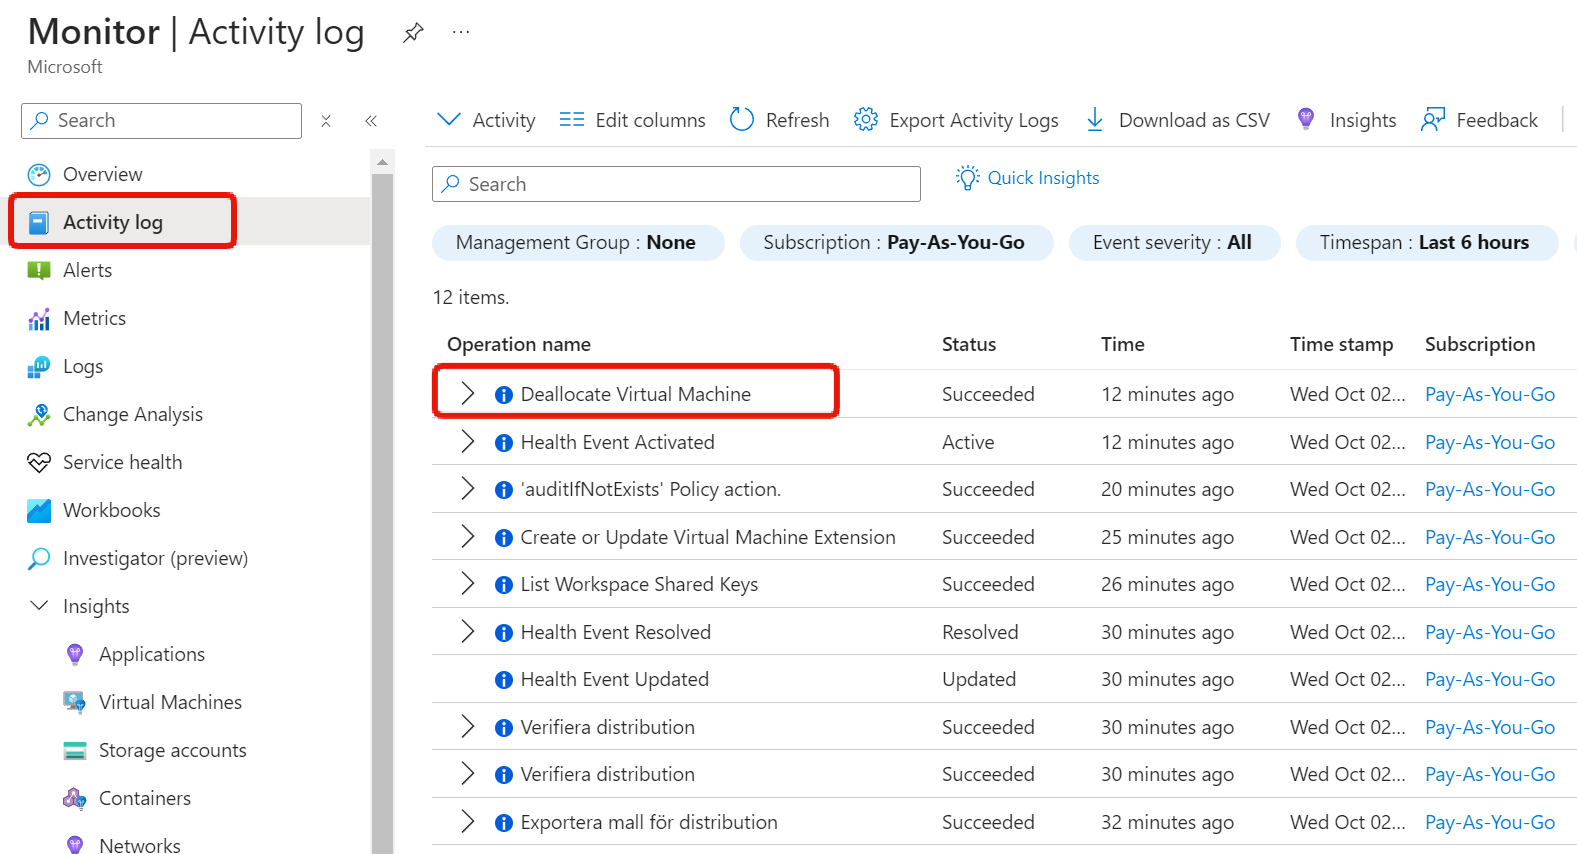
The Activity Log is a log that records write operations (create, modify, delete) performed on Azure resources in your subscription.
It records who did what and when, making it a critical log from an auditing perspective.
By default, activity logs are automatically stored on Azure infrastructure for 90 days. If you want to keep them longer, you can configure them to be sent to a Log Analytics workspace.
Reference:
The Activity Log is one of the “platform logs“. Other platform logs include Microsoft Entra ID logs and resource logs.
As an easy-to-understand example of an activity log, when you stop a virtual machine, a “Deallocate Virtual Machine” log entry is recorded.
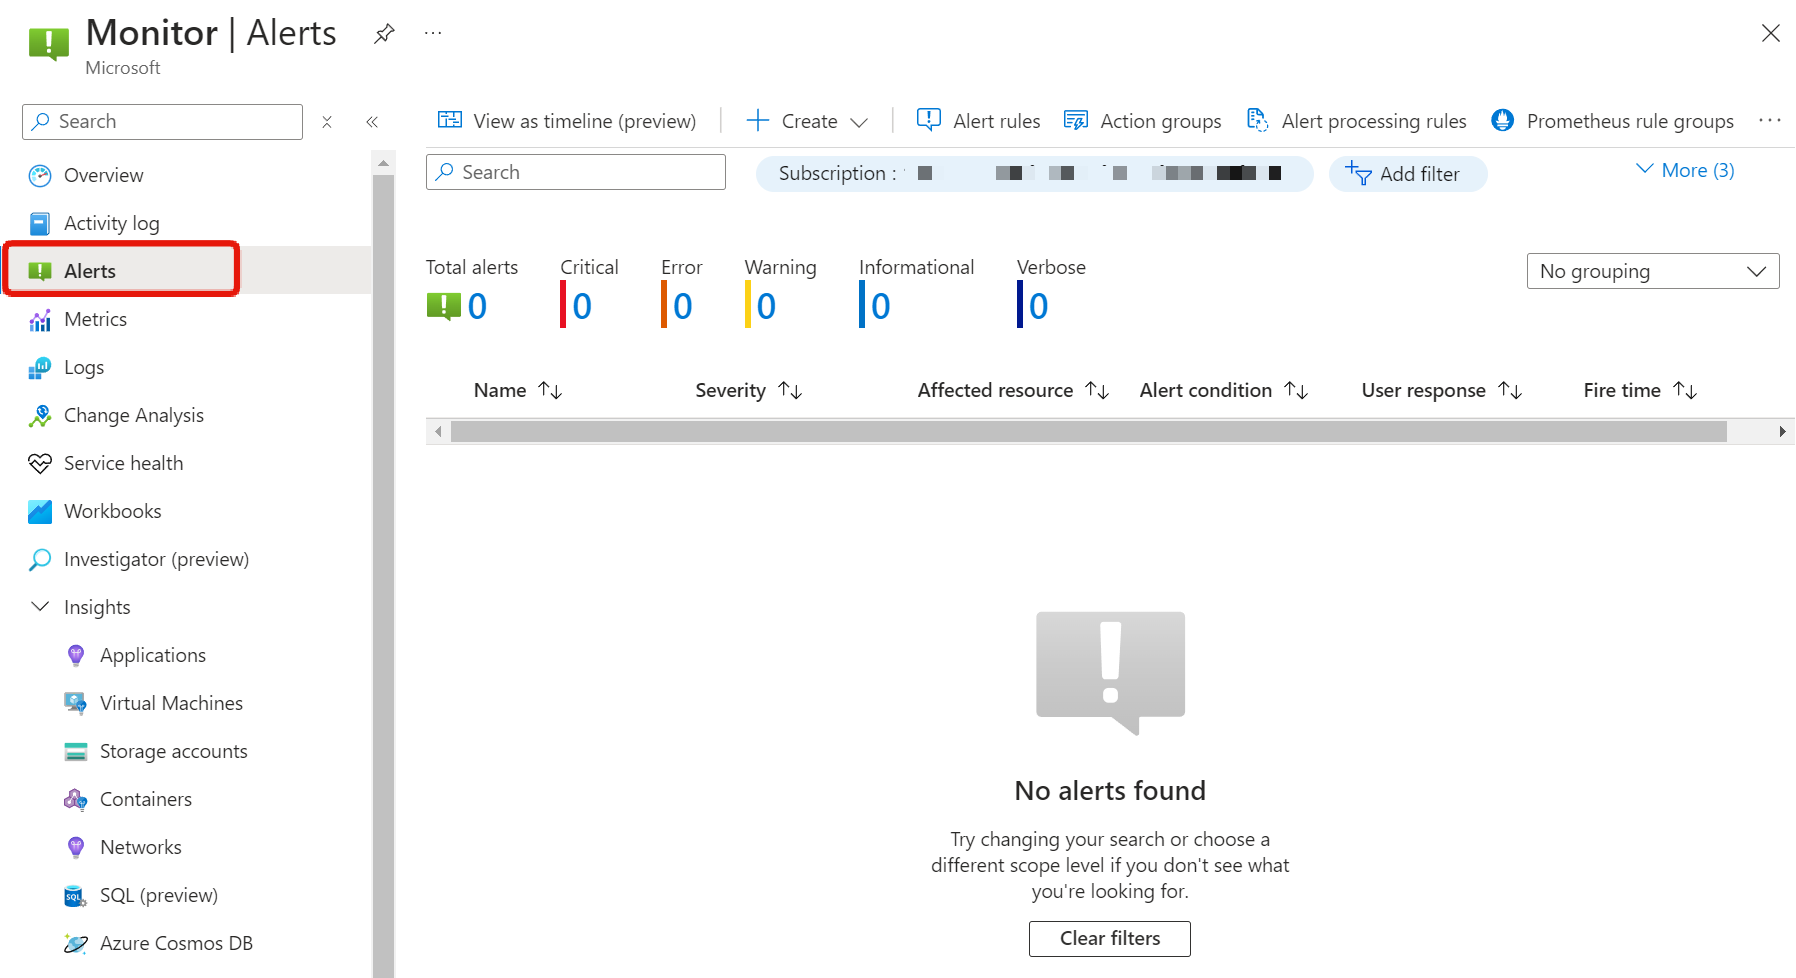
Alerts
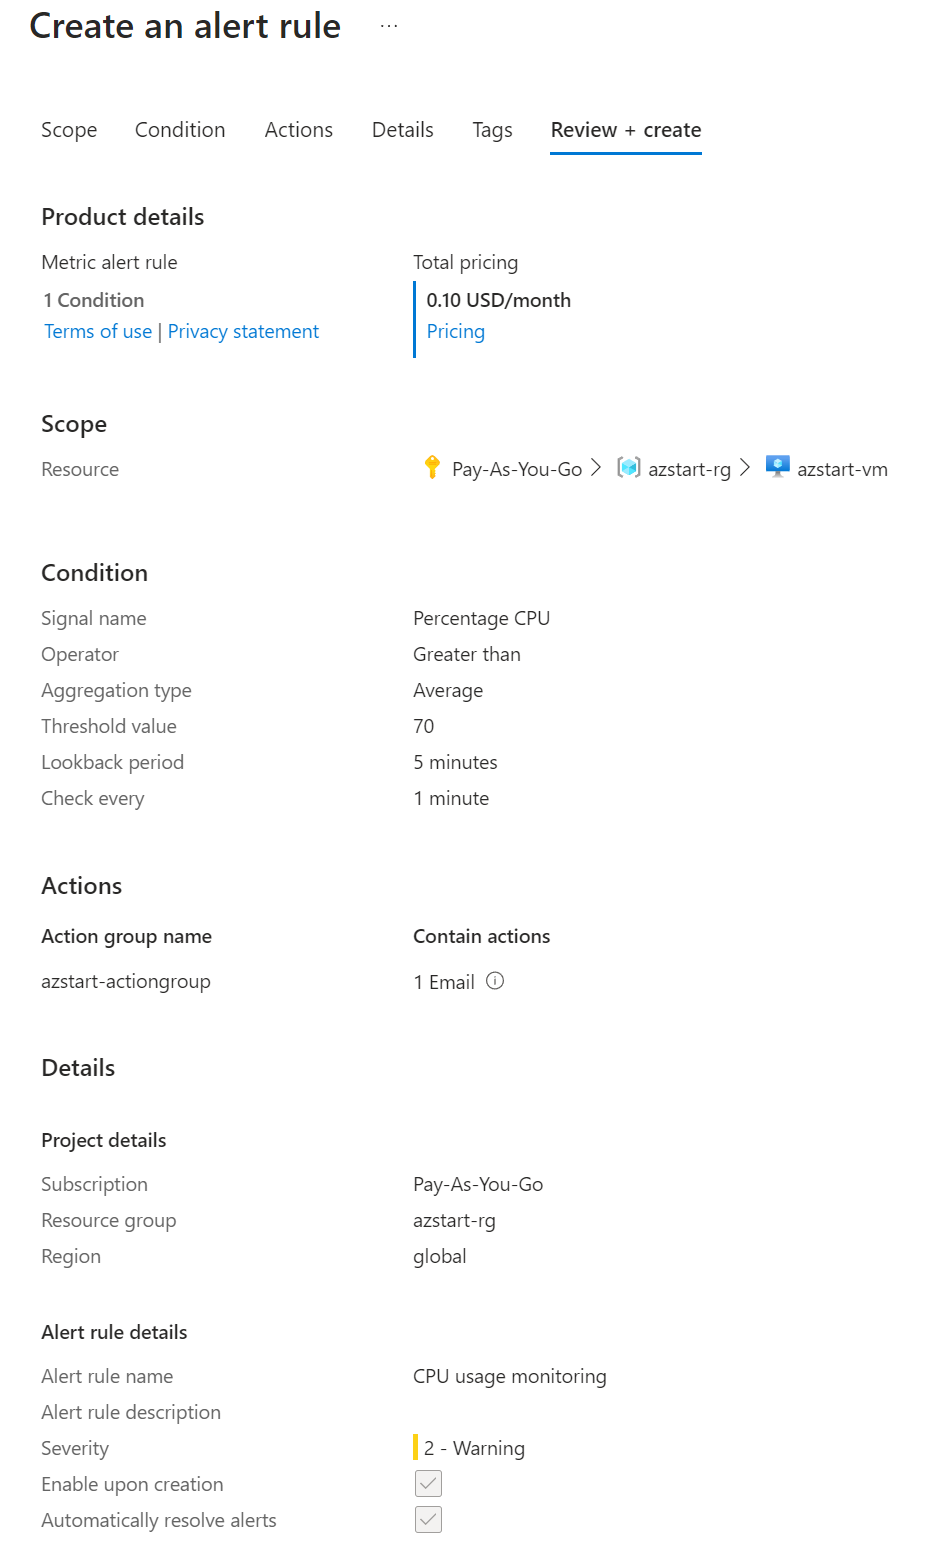
In Alerts, you can set “alert rules” and view their history.
When creating an alert rule, for example
When the average CPU usage of the virtual machine exceeds 70%,
you can specify an action such as
Send an email to a specified destination
using this condition as a trigger.
Metrics
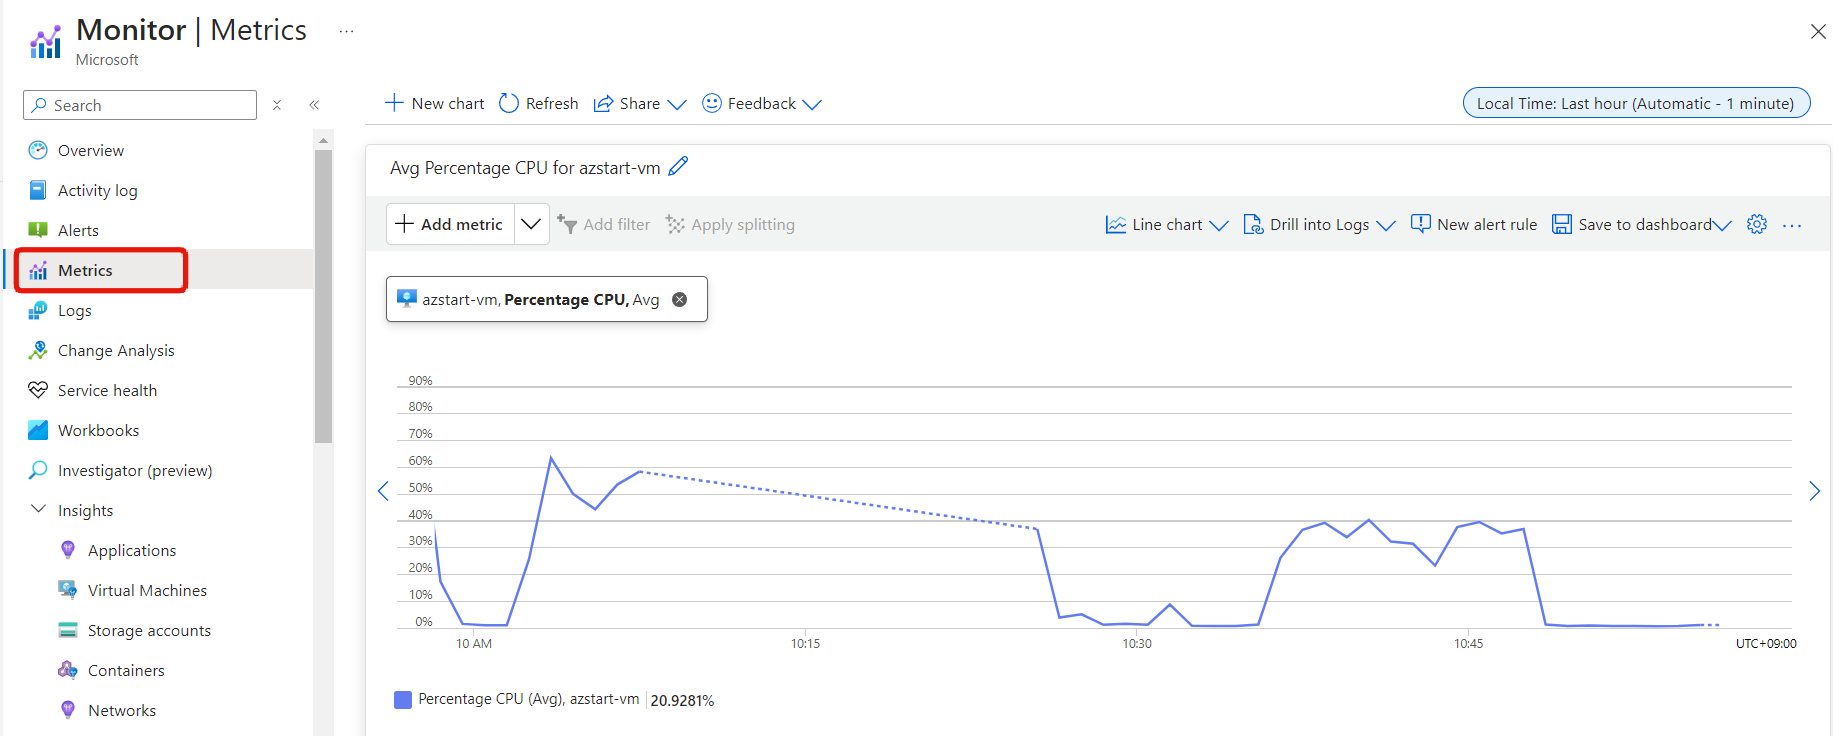
In Metrics, the Metrics Explorer is displayed, allowing you to view resource performance data in graphs.
Standard metrics are collected automatically when you create a resource, with no additional configuration required. Metrics are retained for 93 days.
The following sample screen shows the average CPU usage of a virtual machine (the time when the VM was stopped is shown as a dashed line).
Logs (Azure Monitor logs)
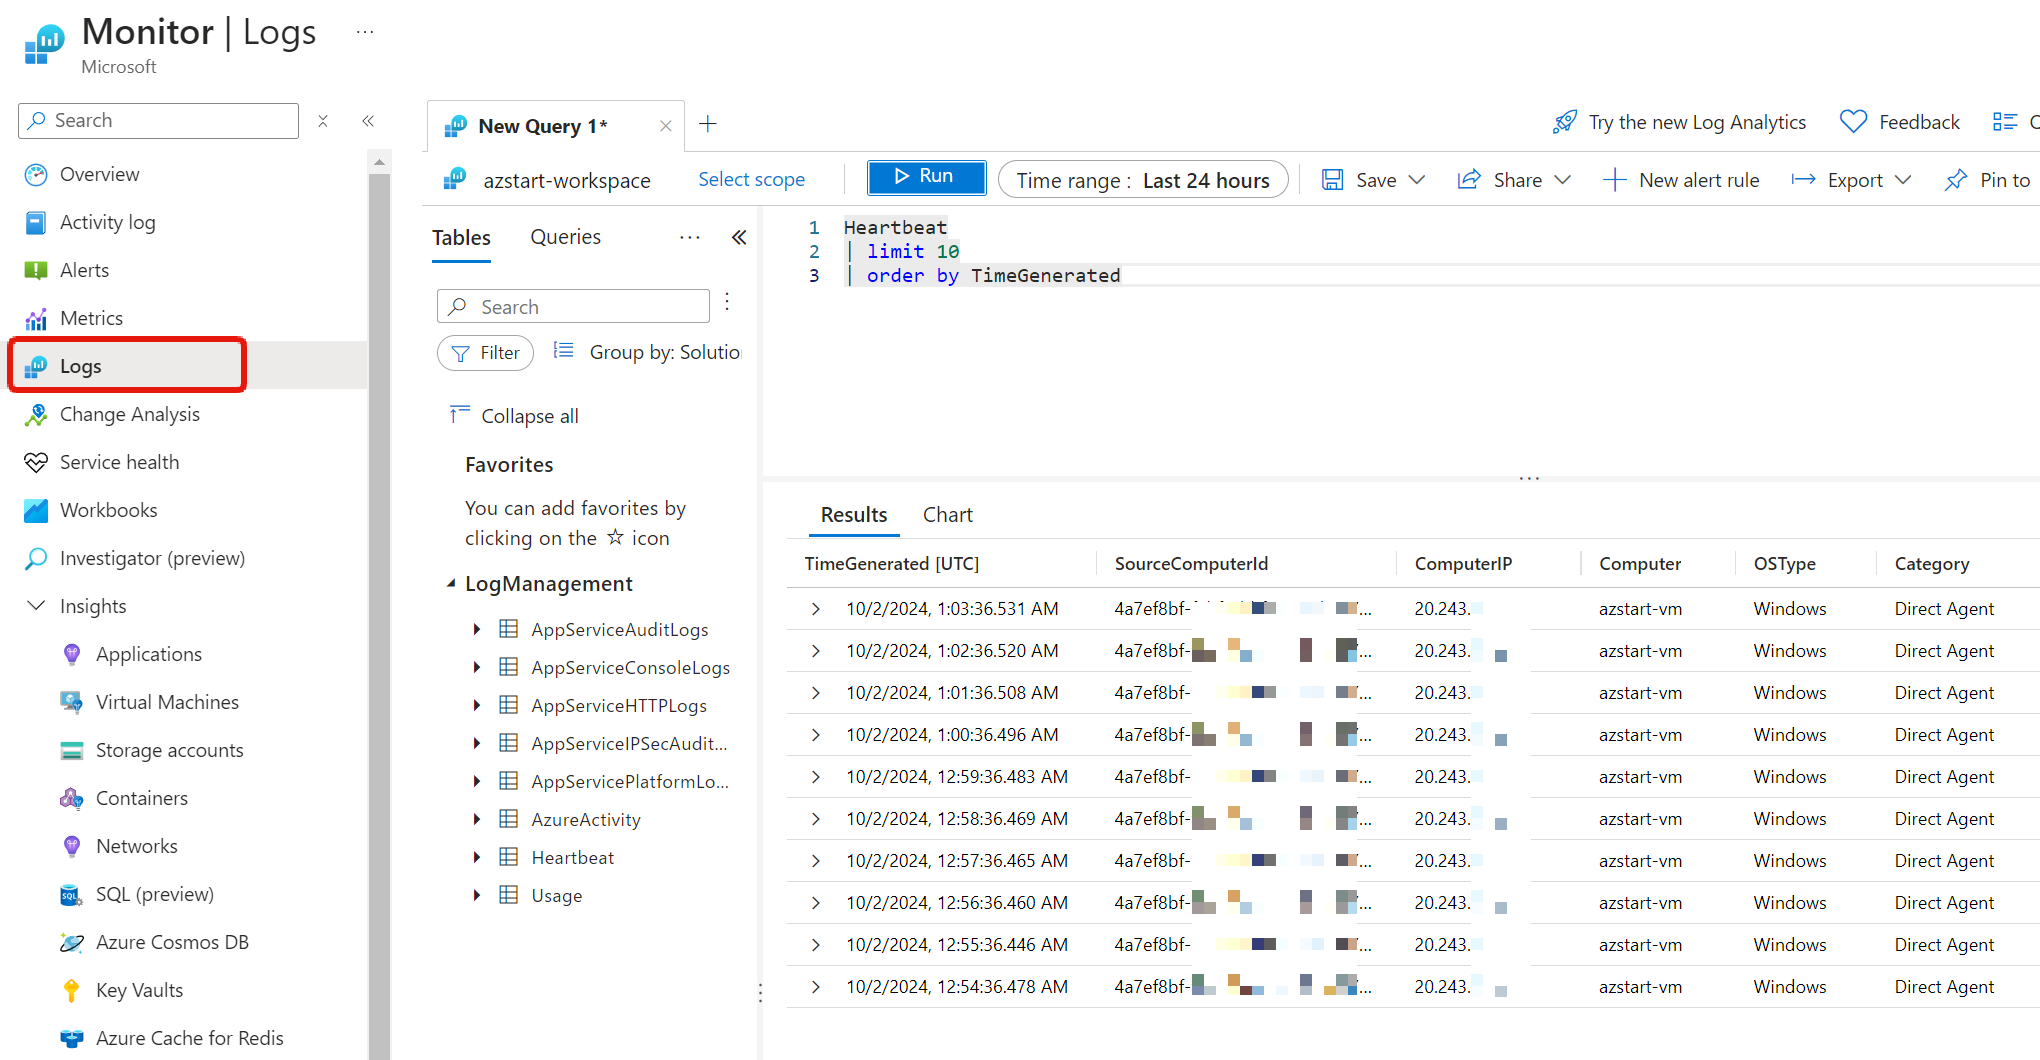
When you select Logs, “Azure Monitor logs (formerly Log Analytics)” launches.
Here, you can analyze the logs collected in the Log Analytics workspace using a query language called KQL (Kusto Query Language).
It may seem a bit daunting at first, but you can quickly extract data, similar to writing SQL statements to SELECT from a database.
To collect data in a Log Analytics workspace, you must install agents on virtual machines or configure diagnostic settings to connect.
The default retention period is 31 days and can be extended up to 2 years (730 days).
Like activity logs, many logs can be configured to be sent to a Log Analytics workspace, making it an important service for centralized log management.
Reference:
The term Log Analytics has been changed to “Azure Monitor logs”. The “Log Analytics workspace” that represents the data storage location remains unchanged.
Application Insights
In the Applications menu, you can create or reference existing resources from Application Insights, which collects application performance and usage data.
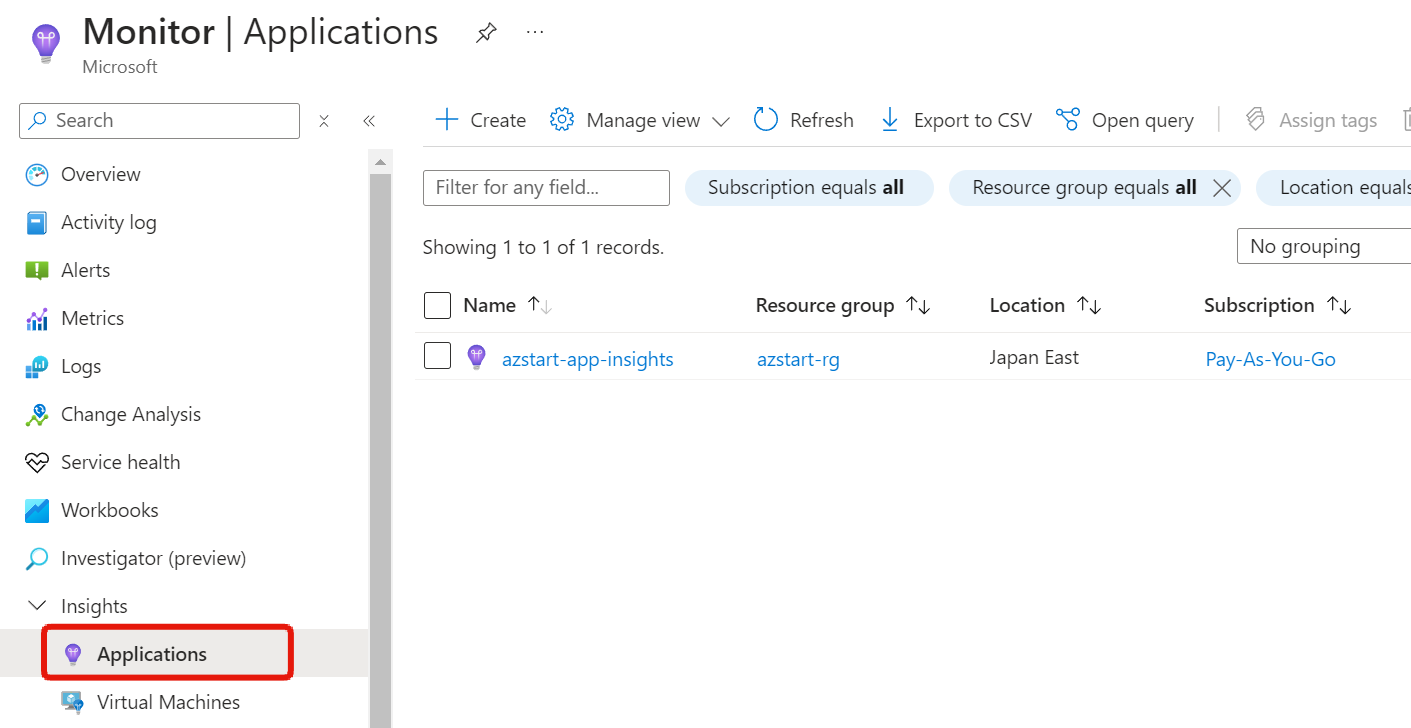 To collect data in Application Insights, you must install a package (SDK) in your application or use the Application Insights agent.
Reference:
Some of the Application Insights data is actually stored in a Log Analytics workspace.
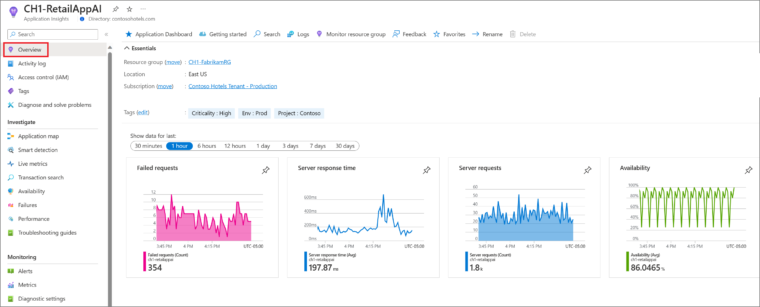
When you navigate to the Application Insights dashboard, you can review information such as:
- Failed requests
- Server response time
- Server requests
- Availability
Summary
In this article, we explained Azure Monitor.
Azure Monitor is an integrated service for monitoring Azure and on-premises servers and applications, and can send notifications via alerts in the event of anomalies.
Let’s make sure we understand the purpose of each of Azure Monitor’s key features.
- Activity Log
- Alerts
- Metrics
- Logs
- Application Insights
See you next time!